Reneging the Paris Climate Agreement

June 4, 2017

On June 1, 2017, as expected, President Donald Trump announced the withdrawal of the United States from the Paris Climate Agreement based on his conclusion that it would โ€œundermine our economy, hamstring our workers, weaken our sovereignty โ€ฆ and put us at a permanent disadvantage to the other countries of the world.โ€ He hopes to negotiate a new agreement โ€œon terms that are fair to the United States.โ€ Almost immediately, in a separate joint statement, French President Emmanuel Macron, Italian Prime Minister Paolo Gentiloni and German Chancellor Angela Merkel said the agreement was a โ€œvital instrument for our planet that cannot be renegotiated.โ€

The President made his decision in the wake of his previous criticism at the G7 meeting of Germanyโ€™s failure to spend 2% of its GNP in military expenditures and its chronic trade surplus with the United States. Subsequently, in a campaign speech, Chancellor Merkel pointedly said that the European Union can no longer โ€œfully count on others.โ€

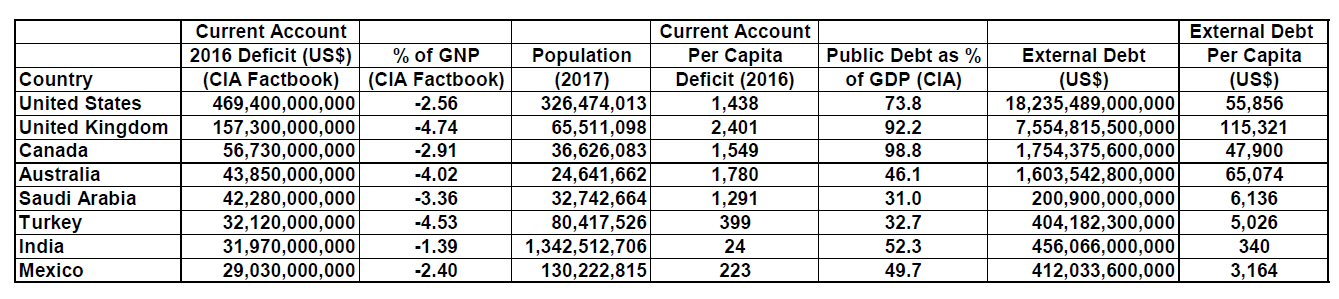
To be sure, he is not wrong about everything. Germany, an export-dependent economy, does indeed have a surplus with the United States, and it does spend less than 2% of its GNP on NATO and the military. But the U.S. has trade deficits (2016, in billions) with China – $347, Canada – $11, Mexico – $63, Japan – $69, and South Korea – $28. Other countries have large deficits too, and they’re not withdrawing.

Largest Trade Deficits

The fact is that manufactured goods made in America by American workers โ€“not robots- are in the aggregate a tiny portion of an economy dominated by services. The U.S. imports more than it exports in every international trade goods category tracked by the Census Bureau.

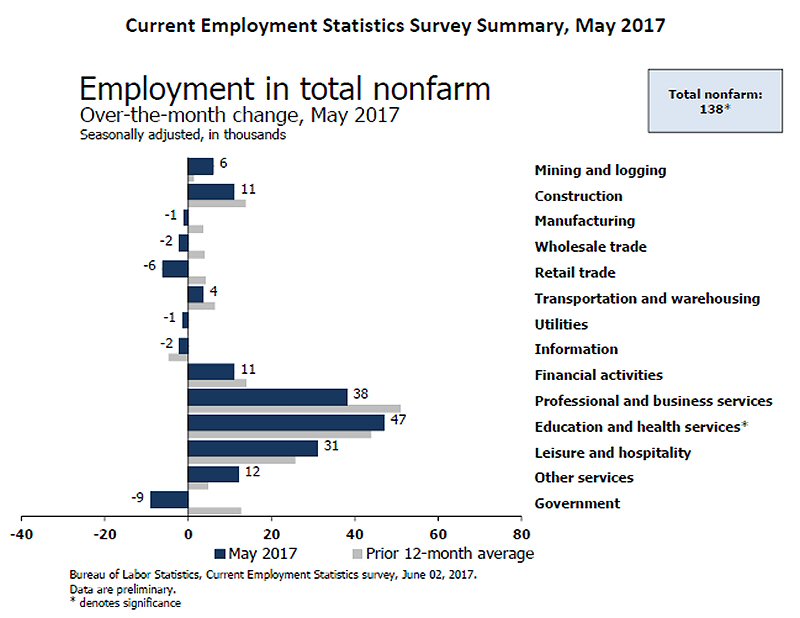
Employment Statistics May 2017


Mr. Trumpโ€™s policy of deporting undocumented workers โ€“whose non-white U.S. born children would almost certainly vote for the Democrats-, has already resulted in acute labor shortages in some occupations that U.S.-born citizens simply will not fill at any price. At this rate soon there wonโ€™t be anyone to harvest our crops, and theyโ€™ll rot in the field. If that happens -assuming other countries have the spare capacity to provide us with what we need, which is by no means certain- weโ€™ll be forced to import our food too, and the trade deficit will expand.

Mr. Trumpโ€™s actions and policies are the complete opposite of what the U.S. needs to do, as he puts it, to โ€œmake America great again.โ€ If he retrenches behind duties and tariffs to protect American-based industries, he will simply ignite a trade war with key NATO ally Germany (and the European Union) and our two largest creditors, Japan and China. That would be counterproductive to say the least.

Withdrawing from the Paris Agreement is not going to reverse the current account deficit or create well paying jobs, on the contrary. The antipathy and ill will for the U.S. that Mr. Trumpโ€™s current policies have already generated among ordinary people worldwide, measured by the declining number of tourists, could well expand to other goods and services โ€“a spontaneous boycott. Instead, he should realize that under present conditions our best bet to reverse the trade deficit is to become the worldโ€™s largest producer of the one element that can wean humankind from its addiction to nuclear energy and fossil fuels โ€“hydrogen. The potential demand for it, foreign and domestic, could realistically create an entire new economy based on its numerous uses. If he does see the light, history might well remember him as indeed the greatest President of all time.


Hydrogen Exports as a Specific Special Drawing Rights (SDR) Criterion

January 29, 2019

Western Reserve Currencies and the Quest for Dominance
Historically, shifts in reserve currencies have brought pivotal changes in the global balance of power. Beginning with the 15th Century, which marked Western Europeโ€™s global ascendancy, the currencies of the empires of Portugal (1450-1530), Spain (1530-1640), the Netherlands (1640-1720), France (1720-1815), Britain (1815-1920), the USA (1920-) and China, still in gestation, have served as primary media of exchange in global trade.

Every shift was preceded by devastating wars and economic cataclysms -even famine. As it pertains to the U.S., whose saga continues to affect and afflict virtually everyone on the planet one way or another, its transformation from the worldโ€™s preeminent surplus and creditor country at the end of World War II into the largest debtor in history and its dangerous non-ideological rivalries with Russia and China in the age of proliferation of nuclear weapons does not bode well for humanity. And yes, proliferation is exactly right. Since 1945, when these nightmarish weapons were first used, India, Israel, North Korea and Pakistan, which at the time werenโ€™t even independent nations, have all acquired them. If history is a precursor of things to come, two things can be inferred. The first is that although a modern war between major powers has not yet exploded thereโ€™s no guarantee it wonโ€™t. The other is that, with little or no warning, non-state extremists may acquire and use miniaturized nuclear weapons.

Hydrogen as the basis for Special Drawing Rights (SDRs)
The value of the IMF’s (International Monetary Fund) SDR basket is based on fiat currencies of former imperial powers: the euro (mainly Germany, France, Portugal, Spain, the Netherlands and Italy), Great Britainโ€™s pound sterling, the United States dollar, Japanโ€™s yen, and Chinaโ€™s renminbi, the newcomer. The IMFโ€™s formula for determining currency weights in the basket assigns equal shares to the currency issuerโ€™s exports and a composite financial indicator. The latter comprises, in equal shares, official reserves denominated in the memberโ€™s (or monetary unionโ€™s) currency that are held by other monetary authorities that are not issuers of the relevant currency, foreign exchange turnover in the currency, and the sum of outstanding international bank liabilities and international debt securities denominated in the currency. However, but for a few exceptions, notably heavily subsidized Israel, these criteria are also heavily stacked against ordinary people in Africa, Latin America, the Middle East and central and southern Asia. They presently lack the means to earn enough SDRs to lift themselves out of poverty and compete on equal terms with their former colonial masters.

Aside from scandalous moral and social issues stemming from the abysmal (and growing) inequality of wealth, extreme poverty, and high morbidity and mortality rates, practically all governments and mainstream media worldwide have chosen to exclude from discourse the obvious drawbacks and dangers these issues pose to everyone, including the elites. One such drawback is that the poor simply do not have enough buying power to contribute to the global economy to help prevent (or at the very least mitigate) recessions or depressions; another is that absolute despair and hopelessness breed hate and extremism, and it has a way of manifesting itself in lethal unexpected ways.

A Crucial Omission and its Solution
The IMFโ€™s current SDR formula has two fatal flaws. Firstly, it does not price the systemโ€™s impact on the environment. Secondly, it does not contritely admit that this omission is the turbine propelling anthropomorphic climate change โ€“which is killing the planet. Accordingly, the obvious way to make amends is to gradually, resolutely and swiftly replace the SDR basket of privileged currencies โ€“all of them- with a formula (whose specific details would be negotiated) based on (a) the total production of hydrogen by electrolysis of sea water (or, in the case of landlocked nations other forms of green energy), (b) the ratio of green energy produced to their population, and (c) their gross national product.

This shift would:
โ€ข Create an economic incentive to produce and use hydrogen to replace fossil fuels to generate electricity and move vehicles.
โ€ข Stop the runaway production of carbon monoxide.
โ€ข Stop the mad competition to achieve and perpetuate a nationโ€™s currency as reserve currency of the world, a path more likely than not to eventually escalate into a terminal thermonuclear war.
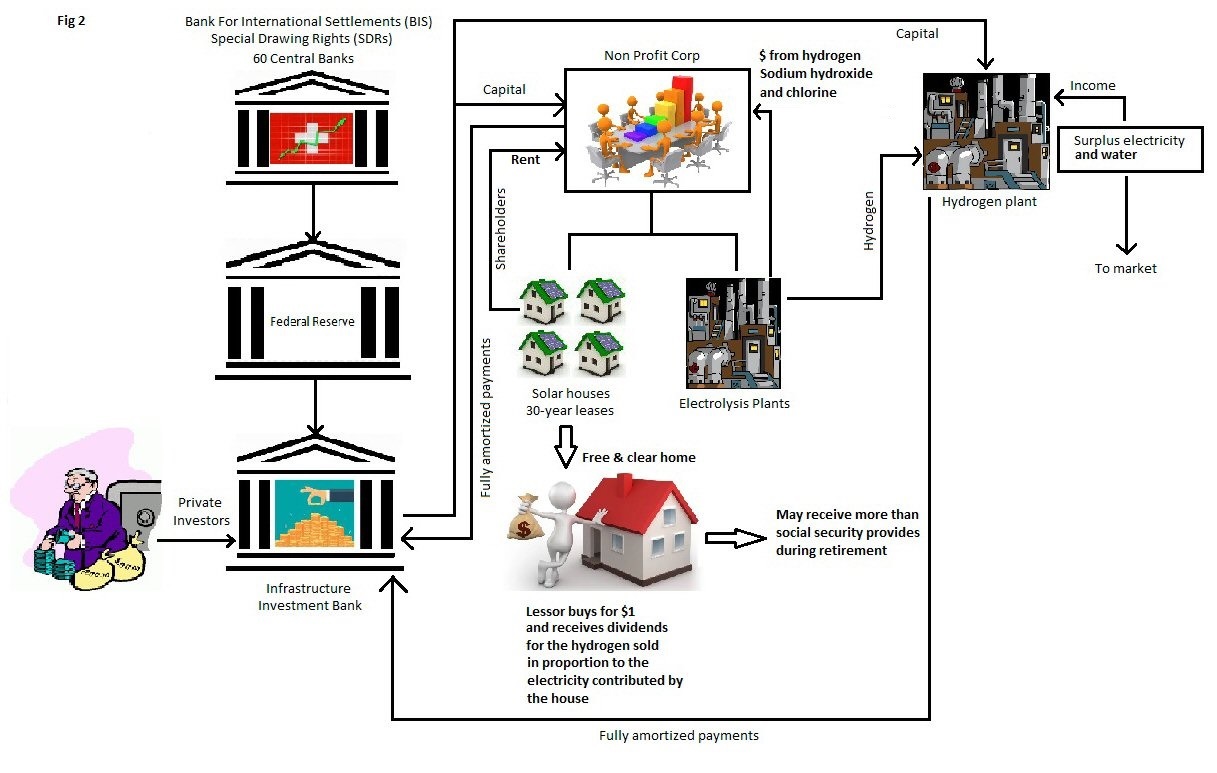
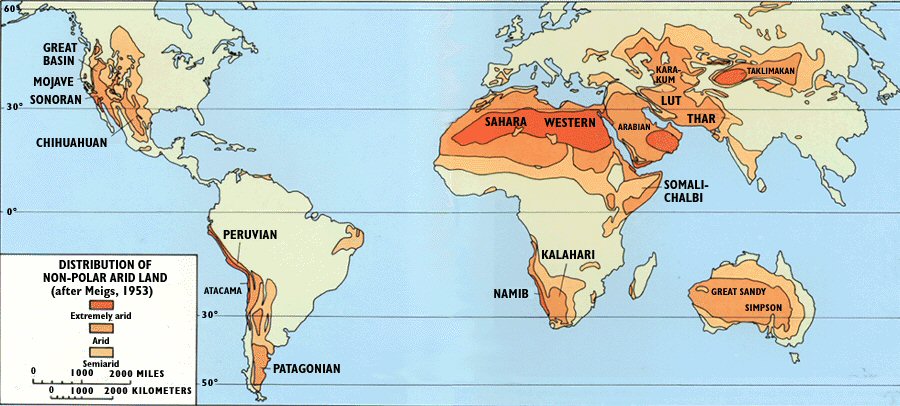
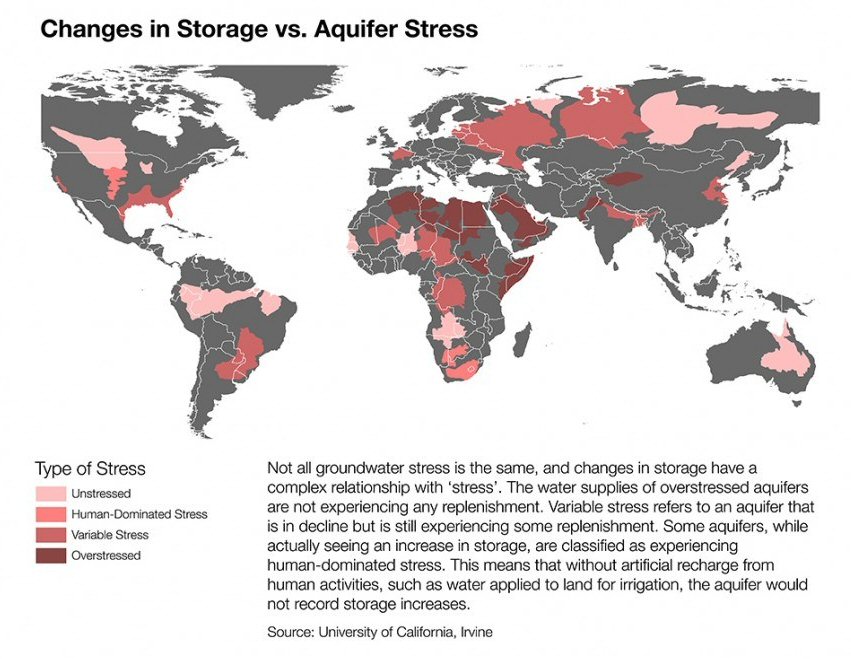
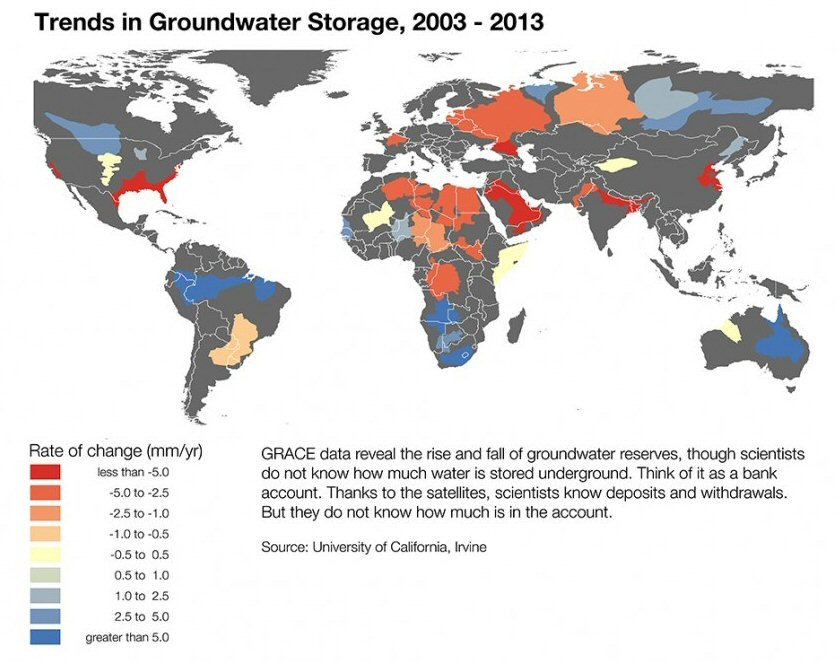
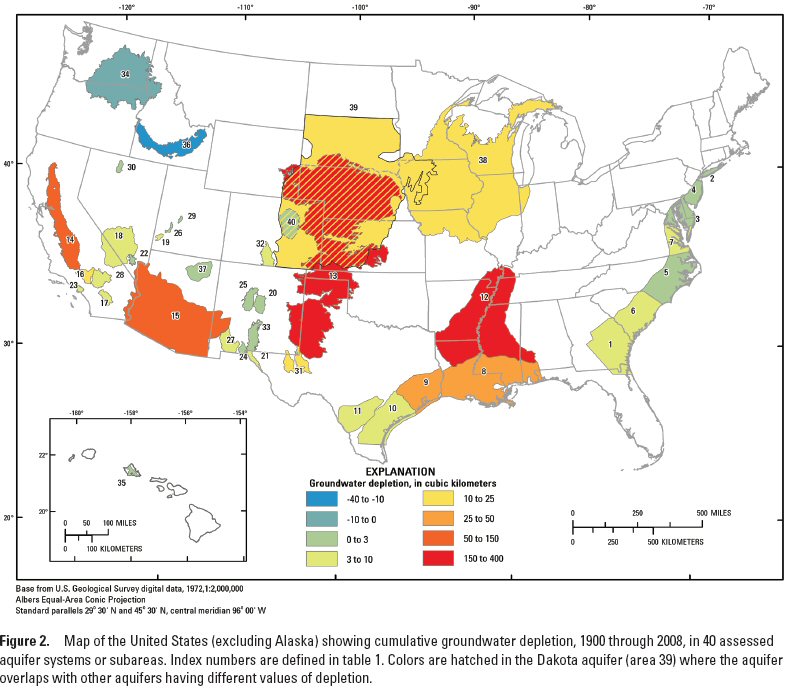
โ€ข Introduce the possibility to actually manufacture, collect and distribute pure water anywhere (simply by burning the hydrogen in power plants) to fight growing water shortages, drought, rapidly depleting aquifers, and desertification aroundย the world.
โ€ข Create a non-fiat, common currency with a fixed, non-depreciable value based on the above mentioned formula to introduce egalitarian buying power for all nations, and stop current and future asset inflation (particularly real estate) that continually and relentlessly cannibalizes our own progeny.

Solar-powered Photocatalytic Water Splitter

May 7, 2017

China’s University of Science and Technology reports that using solar energy to produce hydrogen and oxygen from water is a sustainable technology. A research group led by Professor Xiong Yujie has developed a class of noble-metal-free Z-scheme photocatalysts which exhibit an enhanced performance in photocatalytic hydrogen production based on a facile cation-exchange approach.

Global Oil Reserves

April 22, 2017

Oil reserves by country, their value at $50 per barrel, and loss each would incur if 80% is left in the ground to cope with climate change. Since most of the financial wealth in the world is owned by a minuscule percent of the population (10% in the U.S.) they, not the mass of the people, would lose the most. This begs the question, what would have to happen for them to agree to suffer such losses?

RankCountry   BBL (2016) Value (U.S.$50/Bl)80% in Ground (Loss)
1Venezuela300,000,000,000$15,000,000,000,00012,000,000,000,000
2Saudi Arabia269,000,000,000$13,450,000,000,00010,760,000,000,000
3Canada171,000,000,000$8,550,000,000,0006,840,000,000,000
4Iran157,800,000,000$7,890,000,000,0006,312,000,000,000
5Iraq143,000,000,000$7,150,000,000,0005,720,000,000,000
6Kuwait104,000,000,000$5,200,000,000,0004,160,000,000,000
7United Arab Emirates98,000,000,000$4,900,000,000,0003,920,000,000,000
8Russia80,000,000,000$4,000,000,000,0003,200,000,000,000
9Libya48,360,000,000$2,418,000,000,0001,934,400,000,000
10Nigeria37,000,000,000$1,850,000,000,0001,480,000,000,000
11United States36,520,000,000$1,826,000,000,0001,460,800,000,000
12Kazakhstan30,000,000,000$1,500,000,000,0001,200,000,000,000
13Qatar25,000,000,000$1,250,000,000,0001,000,000,000,000
14China25,000,000,000$1,250,000,000,0001,000,000,000,000
15Brazil16,000,000,000$800,000,000,000640,000,000,000
16Algeria12,000,000,000$600,000,000,000480,000,000,000
17Mexico9,700,000,000$485,000,000,000388,000,000,000
18Ecuador8,832,000,000$441,600,000,000353,280,000,000
19Angola8,400,000,000$420,000,000,000336,000,000,000
20Azerbaijan7,000,000,000$350,000,000,000280,000,000,000
21India5,675,000,000$283,750,000,000227,000,000,000
22Oman5,300,000,000$265,000,000,000212,000,000,000
23Norway5,100,000,000$255,000,000,000204,000,000,000
24Sudan5,000,000,000$250,000,000,000200,000,000,000
25Vietnam4,400,000,000$220,000,000,000176,000,000,000
26Egypt4,400,000,000$220,000,000,000176,000,000,000
27South Sudan3,750,000,000$187,500,000,000150,000,000,000
28Indonesia3,693,000,000$184,650,000,000147,720,000,000
29Malaysia3,600,000,000$180,000,000,000144,000,000,000
30Yemen3,000,000,000$150,000,000,000120,000,000,000
31United Kingdom2,800,000,000$140,000,000,000112,000,000,000
32Uganda2,500,000,000$125,000,000,000100,000,000,000
33Syria2,500,000,000$125,000,000,000100,000,000,000
34Argentina2,400,000,000$120,000,000,00096,000,000,000
35Colombia2,300,000,000$115,000,000,00092,000,000,000
36Gabon2,000,000,000$100,000,000,00080,000,000,000
37Congo1,600,000,000$80,000,000,00064,000,000,000
38Chad1,500,000,000$75,000,000,00060,000,000,000
39Australia1,200,000,000$60,000,000,00048,000,000,000
40Brunei1,100,000,000$55,000,000,00044,000,000,000
41Equatorial Guinea1,100,000,000$55,000,000,00044,000,000,000
42Peru700,000,000$35,000,000,00028,000,000,000
43Trinidad and Tobago700,000,000$35,000,000,00028,000,000,000
44Ghana660,000,000$33,000,000,00026,400,000,000
45Denmark611,000,000$30,550,000,00024,440,000,000
46Turkmenistan600,000,000$30,000,000,00024,000,000,000
47Romania600,000,000$30,000,000,00024,000,000,000
48Uzbekistan600,000,000$30,000,000,00024,000,000,000
49Italy544,500,000$27,225,000,00021,780,000,000
50Japan541,600,000$27,080,000,00021,664,000,000
51Tunisia400,000,000$20,000,000,00016,000,000,000
52Thailand400,000,000$20,000,000,00016,000,000,000
53Pakistan400,000,000$20,000,000,00016,000,000,000
54Ukraine400,000,000$20,000,000,00016,000,000,000
55Turkey300,000,000$15,000,000,00012,000,000,000
56Bolivia209,800,000$10,490,000,0008,392,000,000
57Cameroon200,000,000$10,000,000,0008,000,000,000
58Papua New Guinea200,000,000$10,000,000,0008,000,000,000
59Belarus200,000,000$10,000,000,0008,000,000,000
60Albania200,000,000$10,000,000,0008,000,000,000
61Congo180,000,000$9,000,000,0007,200,000,000
62Niger150,000,000$7,500,000,0006,000,000,000
63Spain150,000,000$7,500,000,0006,000,000,000
64Chile150,000,000$7,500,000,0006,000,000,000
65Netherlands144,700,000$7,235,000,0005,788,000,000
66Cuba124,000,000$6,200,000,0004,960,000,000
67Cote d’Ivoire100,000,000$5,000,000,0004,000,000,000
68Poland100,000,000$5,000,000,0004,000,000,000
69Germany100,000,000$5,000,000,0004,000,000,000
70Serbia100,000,000$5,000,000,0004,000,000,000
71Philippines100,000,000$5,000,000,0004,000,000,000
72Bahrain100,000,000$5,000,000,0004,000,000,000
73Suriname88,970,000$4,448,500,0003,558,800,000
74France84,080,000$4,204,000,0003,363,200,000
75Guatemala83,070,000$4,153,500,0003,322,800,000
76Croatia71,000,000$3,550,000,0002,840,000,000
77New Zealand67,200,000$3,360,000,0002,688,000,000
78Burma50,000,000$2,500,000,0002,000,000,000
79Austria47,500,000$2,375,000,0001,900,000,000
80Kyrgyzstan40,000,000$2,000,000,0001,600,000,000
81Georgia35,000,000$1,750,000,0001,400,000,000
82Bangladesh28,000,000$1,400,000,0001,120,000,000
83Hungary27,190,000$1,359,500,0001,087,600,000
84Mauritania20,000,000$1,000,000,000800,000,000
85South Africa15,000,000$750,000,000600,000,000
86Czechia15,000,000$750,000,000600,000,000
87Bulgaria15,000,000$750,000,000600,000,000
88Israel13,950,000$697,500,000558,000,000
89Lithuania12,000,000$600,000,000480,000,000
90Tajikistan12,000,000$600,000,000480,000,000
91Taiwan10,060,000$503,000,000402,400,000
92Greece10,000,000$500,000,000400,000,000
93Slovakia9,000,000$450,000,000360,000,000
94Benin8,000,000$400,000,000320,000,000
95Belize6,700,000$335,000,000268,000,000
96Barbados2,530,000$126,500,000101,200,000
97Jordan1,000,000$50,000,00040,000,000
98Morocco680,000$34,000,00027,200,000
99Ethiopia430,000$21,500,00017,200,000
Total1,662,268,960,000$83,113,426,500,00066,490,741,200,000

Source: CIA World Factbook

Distribution of Wealth in the U.S.

April 22, 2017

In the United States, wealth is highly concentrated in relatively few hands. As of 2013, the top 1% of households (the upper class) owned 36.7% of all privately held wealth, and the next 19% (the managerial, professional, and small business stratum) had 52.2%, which means that just 20% of the people owned a remarkable 89%, leaving only 11% of the wealth for the bottom 80% (wage and salary workers). In terms of financial wealth (total net worth minus the value of one’s home), the top 1% of households had an even greater share: 42.8%. Table 2 and Figure 1 present further details, drawn from the careful work of economist Edward N. Wolff at New York University (2017).

Table 1: Distribution of net worth and financial wealth in the United States, 1983-2013


 Total Net Worth
Top 1 percentNext 19 percentBottom 80 percent
198333.8%47.5%18.7%
198937.4%46.2%16.5%
199237.2%46.6%16.2%
199538.5%45.4%16.1%
199838.1%45.3%16.6%
200133.4%51.0%15.6%
200434.3%50.3%15.3%
200734.6%50.5%15.0%
201035.1%53.5%11.4%
201336.7%52.2%11.1%
 Financial (Non-Home) Wealth
Top 1 percentNext 19 percentBottom 80 percent
198342.9%48.4%8.7%
198946.9%46.5%6.6%
199245.6%46.7%7.7%
199547.2%45.9%7.0%
199847.3%43.6%9.1%
200139.7%51.5%8.7%
200442.2%50.3%7.5%
200742.7%50.3%7.0%
201041.3%53.5%5.2%
201342.8%51.9%5.3%

Total assets are defined as the sum of: (1) the gross value of owner-occupied housing; (2) other real estate owned by the household; (3) cash and demand deposits; (4) time and savings deposits, certificates of deposit, and money market accounts; (5) government bonds, corporate bonds, foreign bonds, and other financial securities; (6) the cash surrender value of life insurance plans; (7) the cash surrender value of pension plans, including IRAs, Keogh, and 401(k) plans; (8) corporate stock and mutual funds; (9) net equity in unincorporated businesses; and (10) equity in trust funds. Total liabilities are the sum of: (1) mortgage debt; (2) consumer debt, including auto loans; and (3) other debt. From Wolff (2017).

Figure 1: Net worth and financial wealth distribution in the U.S. in 2010

From Wolff (2017).

In terms of types of financial wealth, in 2013 the top one percent of households had 49.8% of all privately held stock, 54.7% of financial securities, and 62.8% of business equity. The top ten percent had 84% to 94% of stocks, bonds, trust funds, and business equity, and almost 80% of non-home real estate. Since financial wealth is what counts as far as the control of income-producing assets, we can say that just 10% of the people own the United States of America; see Table 2 for the details. The only category which is not skewed severely toward the upper class is debt.

Table 2: Wealth distribution by type of asset, 2013

 Investment Assets
Top 1 percentNext 9 percentBottom 90 percent
Business equity62.8%31.0%6.2%
Financial securities54.7%39.6%5.7%
Stocks and mutual funds49.8%41.2%9.1%
Trusts49.5%34.0%16.5%
Non-home real estate33.7%44.1%22.2%
TOTAL investment assets51.5%37.0%11.5%


Additional 304 Million Cubic Feet of Natural Gas Discovered

April 22, 2017

In a report, the U.S. Geological Survey estimates there are 304 trillion cubic feet of natural gas in the Bossier and Haynesville formations of the U.S. Gulf Coast. If true, this would increase production of fossil fuels and greenhouse gas emissions at a time when the ongoing devastating environmental consequences require humanity cease using not only fossil fuels but fission (remember Fukushima and Chernobyl) as well. This of course would require the energy industry to voluntarily renounce the untold wealth beneath their feet and a simultaneous immediate shift to renewable, free, and universally available resources -such as solar, hydrogen and gravity. In short, our species must choose between survival and greed.

Banning Nuclear Weapons

April 21, 2017

The ongoing tension between the U.S. and Russia over NATO’s expansion to the Baltic and Black Seas -and Russia’s strategic countermeasures in the Crimea, the Ukraine, Syria, and to a lesser extent Iran- is reminiscent of the powder keg that was Europe just prior to World War I -you know, the war to end all wars. Add to that the dispute over the South China Sea, the East China Sea and the technical state of war that still exists between North and South Korea backed by their respective covert and overt allies, China and the U.S., and what we have is an extraordinarily high probability that the struggle for global preeminence -for that is what it really is- will spiral into a terminal war. Viewed in that context, climate change is indeed immaterial: there won’t be future generations to suffer its consequences.

The risk to the species’ survival stems from one word: nuclear. The bombs -the U.S. and Russia both have approximately 7,000- would envelop the world in a radioactive cocoon and cause a nuclear winter; and should the ever-growing number of nuclear-powered vessels be sunk, they would become de facto Fukushimas at the bottom of the ocean. No chance for life as we know it.

The elites who run the nuclear-armed states and their close allies -not to be confused with ordinary people, who would rather live out their lives in peace- refuse to destroy and outlaw these weapons; yet at the same time, they seek to prevent their proliferation. Talk about a double standard.

Fortunately the rest of mankind has coalesced into a movement to eliminate these weapons, before they eliminate us all. And it is being done nicely, peacefully, diplomatically. But if that fails, what are they to do -withdraw en masse from the Non Proliferation Treaty?

Under the Dead Sea, Warnings of Dire Drought -2017

A study from Columbia University/Earth Institute Lamont-Doherty Earth Observatory revealed that the Middle East has experienced devastating droughts when the earth went through hotter periods 120,000 and 10,000 years ago. The data suggest this time around it may be worse due to a high demand for fresh water from a growing population.

WordPress theme: Kippis 1.15
Translate ยป