Ogallala Drying Up

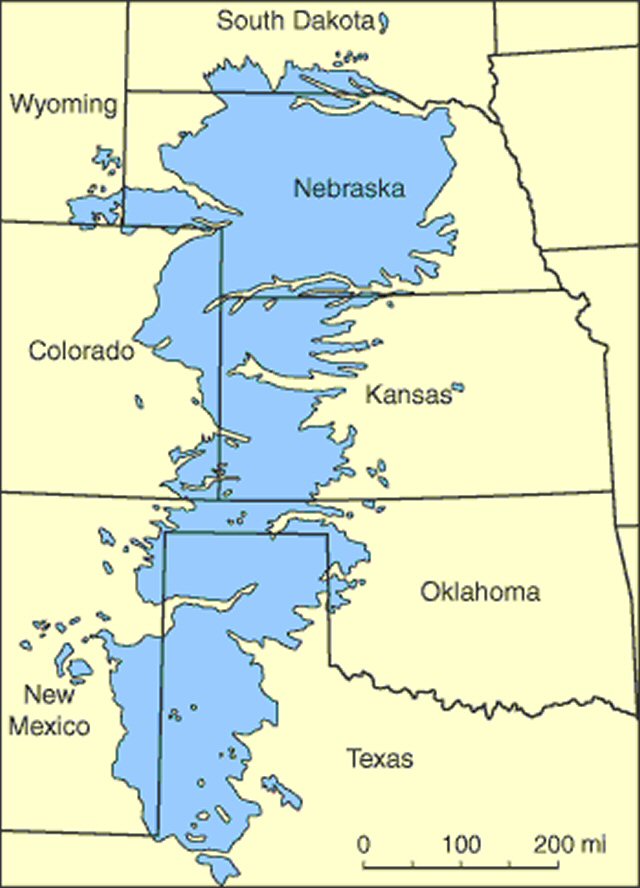
Dramatic article describing in great detail how the Ogallala Aquifer
Ogallala Map

beneath eight (8) states in the Great Plains, the breadbasket of the United States and a good portion of the world, is being depleted at an astonishing rate. It’s fossil water 10 million years old, and rain does not recharge it. Incidentally, aquifer depletion is not limited to the U.S. China and India, to name two, are having similar problems. Clearly, the world is facing a catastrophe. Food production will decline just as the population explodes to an estimated 9 billion by 2050.

Depletion of Aquifers

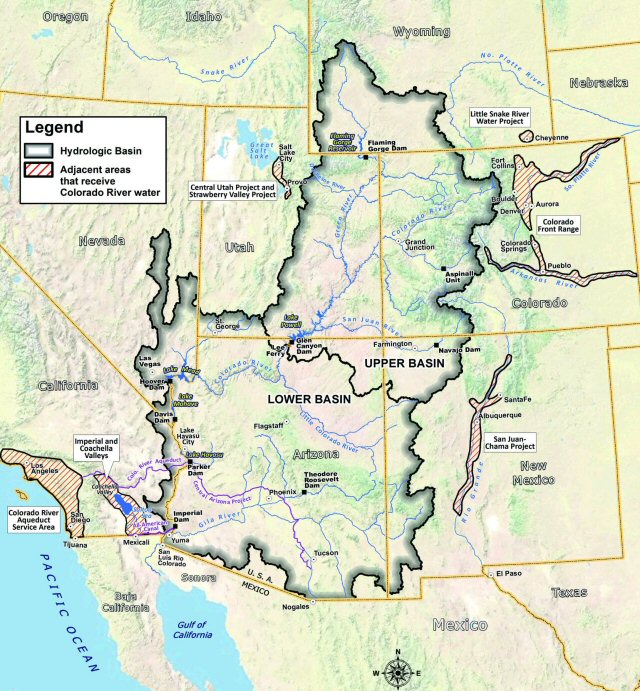
A study found in the Geophysical Research Letters of the Colorado River Basin that serves 40 million people in Arizona, Colorado, Utah, Wyoming, California, New Mexico and Nevada
Colorado River Basin

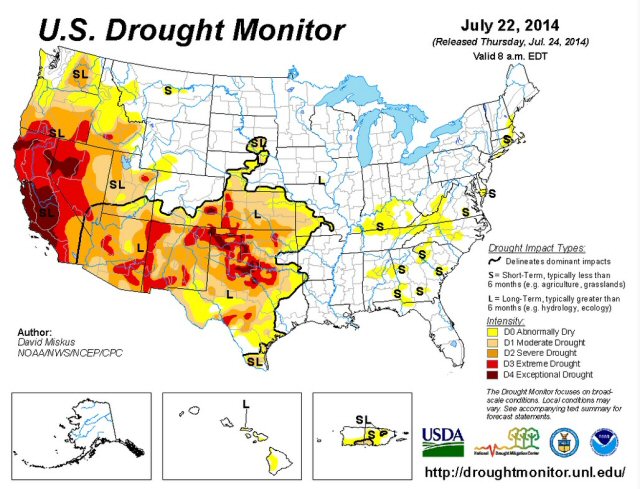
shows that the 14-year drought across the western United States has sapped underground water on a much larger scale than previously believed.
Dourght 7-22-2014

Fully three quarters of the water loss –53 million acre feet (65 cubic kilometers)- has come from aquifer depletion, an amount almost double the volume of the nation’s largest reservoir, Lake Mead.
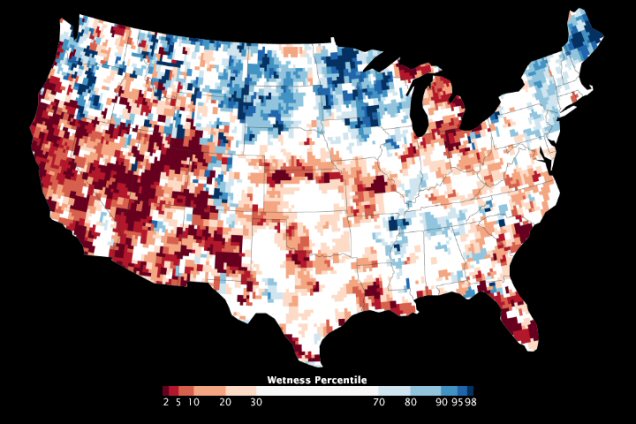
Aquifer Depletion Map

This is the first study to quantify the amount that groundwater contributes to the area’s use; however no one knows how much is left or when it will run out. The data shows a high and long-term reliance on groundwater to make up the difference between supply and demand at a time when declining snowpack and population growth threaten the long-term ability of the basin to meet its water allocation commitments.

Colorado River Study -2012

Landmark 2012 study (in English, .pdf file) prepared by the U.S. Bureau of Reclamation detailing the alarming condition of the Colorado River. The unrelenting drought, which began in 1999, declining precipitation due to global warming, and increasing demand will inevitably result in a chronic shortfall. In an effort to offset it, states are pumping more groundwater, but that too is unsustainable as it is being rapidly depleted. Since 80% of the water is used in agriculture, food production will decline, new construction will be stymied, and thousands of jobs will be lost. In a nutshell, unless something drastic is done, and soon, the situation will get much, much worse.

California Drought Photos 2013-2014

Global warming at work

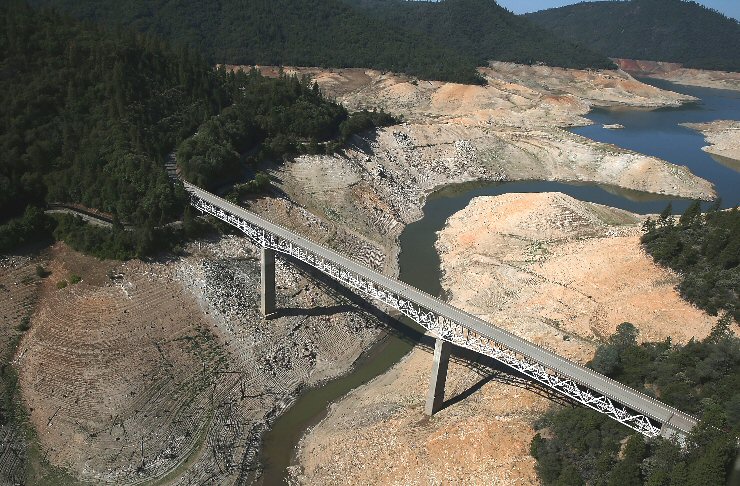
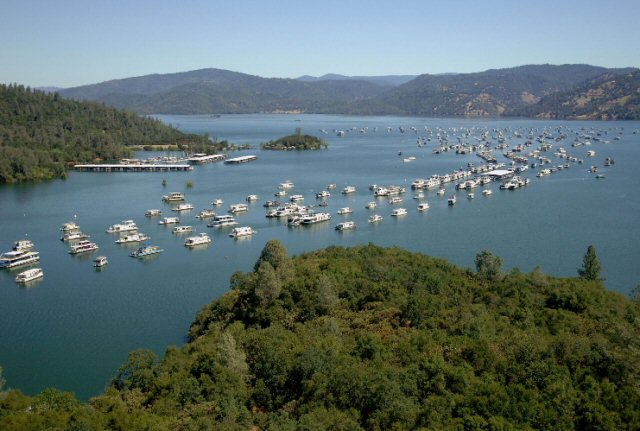
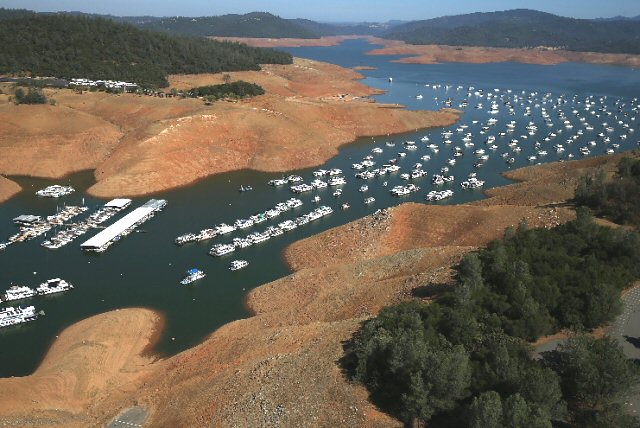
Before and after photos taken at Lake Oroville, CA on 07/20/2011 and 08/19/2014.
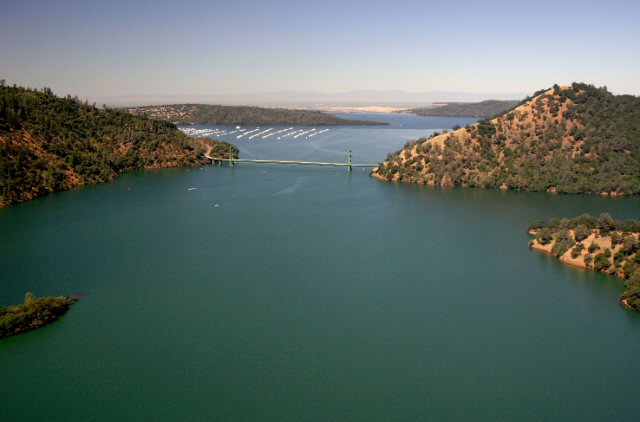
Lake Oroville, CA 7-20-2011
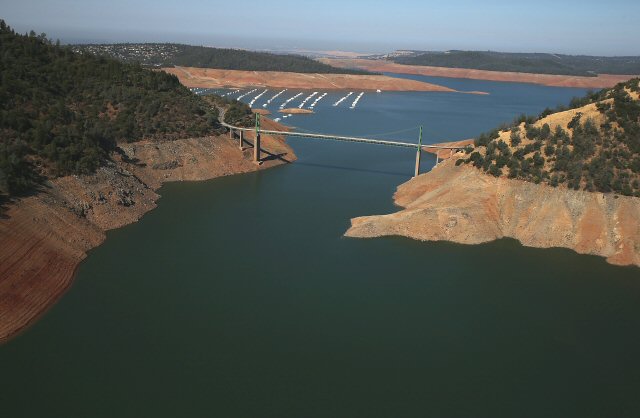
Lake Oroville, CA 7-20-2011

Lake Oroville, CA 8-19-2014
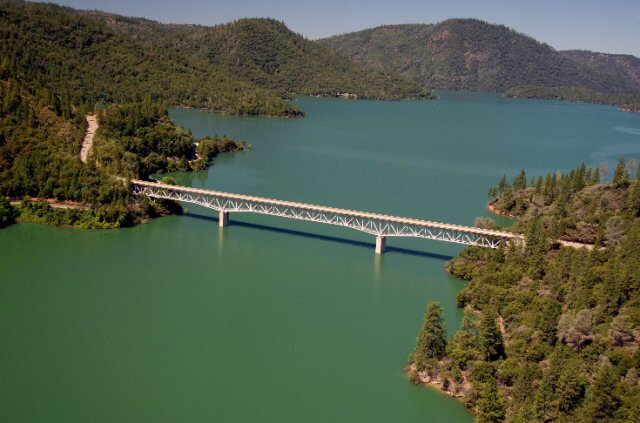
Lake Oroville, CA 8-19-2014

Enterprise Bridge, Lake Oroville, CA 7-20-2011
Enterprise Bridge, Lake Oroville, CA 7-20-2011

Enterprise Bridge, Lake Oroville, CA 8-19-2014
Enterprise Bridge, Lake Oroville, CA 8-19-2014

Bidwell Marina, Lake Oroville, CA 7-20-2011
Bidwell Marina, Lake Oroville, CA 7-20-2011

Bidwell Marina, Lake Oroville, CA 8-19-2014
Bidwell Marina, Lake Oroville, CA 8-19-2014

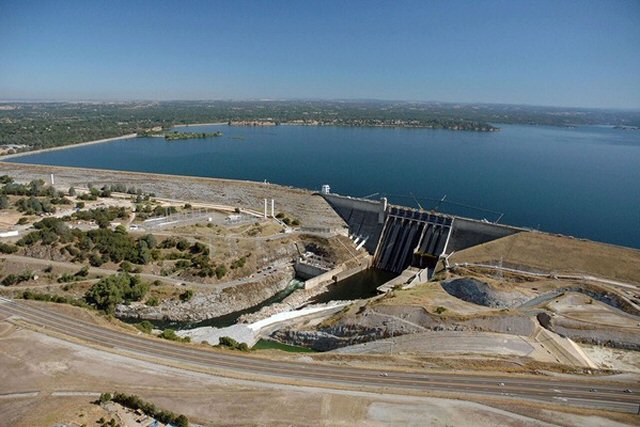
Folsom Dam, 7-20-2011
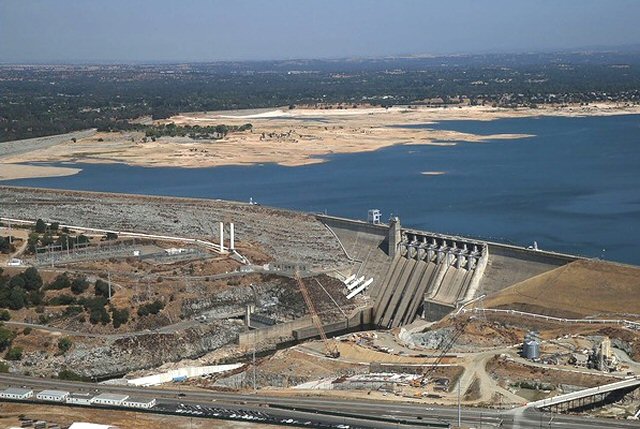
Folsom Dam, 7-20-2011

Folsom Dam, 8-20-2014
Folsom Dam, 8-20-2014

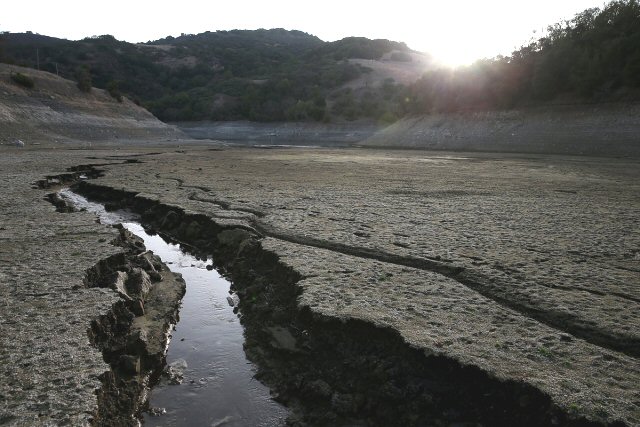
Almaden Reservoir, San Jose, CA 01-28-2014

Almaden Reservoir, San Jose, CA 01-28-2014

California Drought Report -2014

Comprehensive report (in English, .pdf file) prepared by the University of California at Davis detailing the economic loss to the State of California due a pervasive drought that has caused the greatest ever net loss of water.

Polluted Chinese Waters

Chinese Pollution

Here’s why there’s a vast, untapped market for hydrogen: China needs it to generate electricity, manufacture pure water by aquafacture, and clean up its air. Currently it’s not cost effective to produce hydrogen on that scale because its principal source is fossil fuels, so it’s cheaper and more efficient to use the fuels directly to generate electricity. Plan A compensates for the inefficiency without polluting the environment.

Yellow pollution

Polluted Green Lake

Green Yangtze

Toxic Waste to River

Yangtze River

Yangtze River

Purple river

Purple river

Pink pollution

Pink pollution

Pink pollution & city

Pink pollution & city

Coal plant, steel factory, polluted water

Coal plant, steel factory, polluted water

Death

Death

Chinese & Australian Shale Gas

Chinese & Australian Shale Gas

05/29/2014

China

Although serious obstacles remain, China is finally making progress on tapping its vast shale gas reserves, which hold the promise of a new source of clean energy for the coal smoke-choked country.

According to the U.S. Energy Information Administration, China holds the world’s largest reserves of technically recoverable shale gas in the world, 1,115 trillion cubic feet. That’s about 68 percent more than what the U.S. holds.

A report from Bloomberg New Energy Finance finds that China may actually hit its 2015 shale gas production target, which the central government has mandated. Researchers analyzed the results of well data from the Fuling block in the Sichuan Basin, state-owned firm Sinopec is making substantial progress, and the national target of 6.5 billion cubic meters per year (480 million cubic feet per day) by 2015 could be within reach.

By 2017, China is aiming to lift natural gas consumption to 9 percent of total energy demand, up from 5.2 percent in 2013. China has already made some progress on that front, as natural gas only made up 4 percent of energy demand just two years ago (see chart).

Chinese Energy Consumption

Chinese Energy Consumption

Australia

Australia is building a massive project for new liquefied natural gas (LNG). Already one of the world’s largest exporters of LNG, Australia plans on moving to the top spot over the next 3-4 years, potentially overtaking Qatar. It currently has the capacity to export 23 million tons per annum (mtpa), but it plans to almost quadruple that total by 2017. The 62 mtpa under construction there accounts for almost two-thirds of the total LNG capacity under construction around the world.

WordPress theme: Kippis 1.15
Translate »