[google-translator]
Water-Energy Nexus report issued by the U.S. Department of Energy, June 2014. Lengthy .pdf document in English, may take a few minutes to load.
[google-translator]
Water-Energy Nexus report issued by the U.S. Department of Energy, June 2014. Lengthy .pdf document in English, may take a few minutes to load.
[google-translator]
The 2014 United Nations World Water Development Report (external .pdf link in English). Large file, 230 pages, may take minutes to load.
[google-translator]
Here’s why there’s a vast, untapped market for hydrogen: China needs it to generate electricity, manufacture pure water by aquafacture, and clean up its air. Currently it’s not cost effective to produce hydrogen on that scale because its principal source is fossil fuels, so it’s cheaper and more efficient to use the fuels directly to generate electricity. Plan A compensates for the inefficiency without polluting the environment.
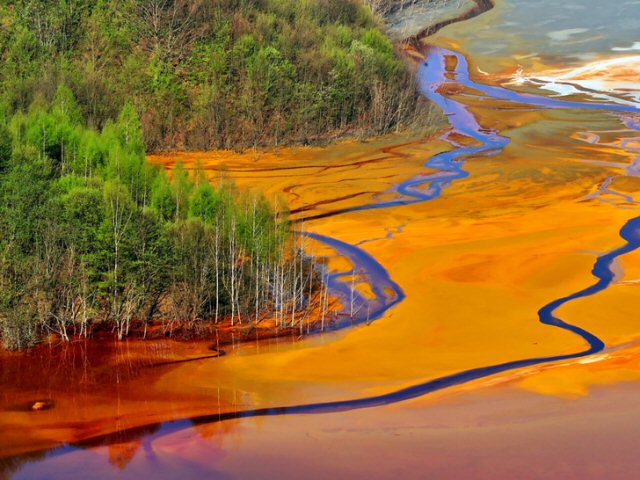
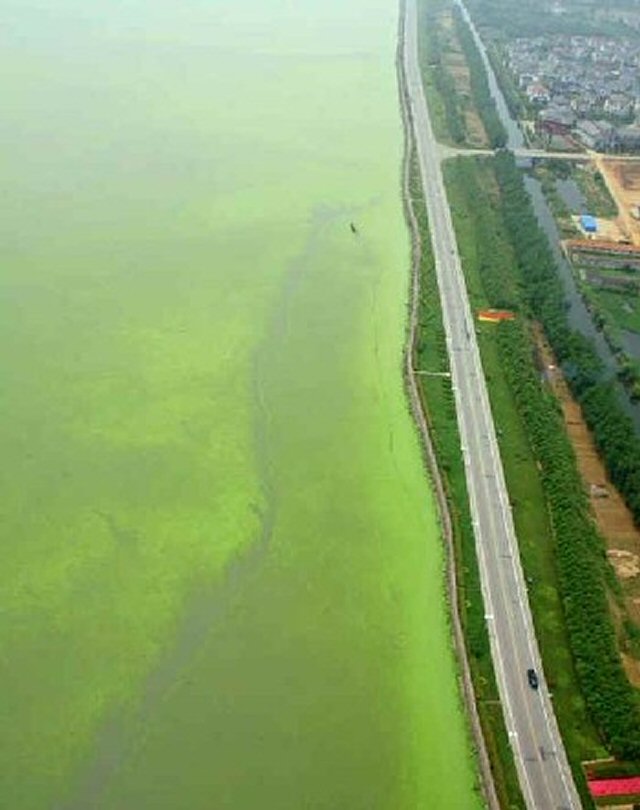
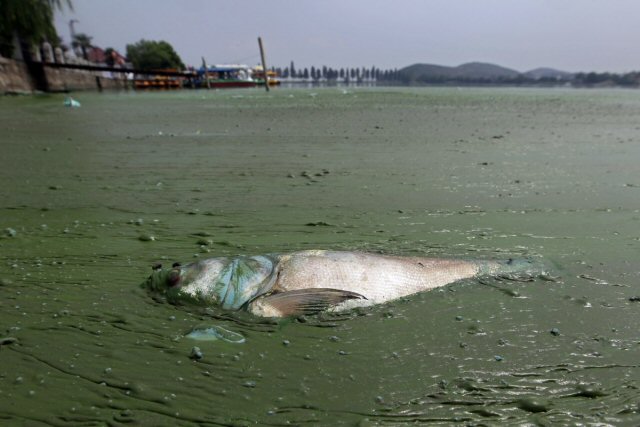
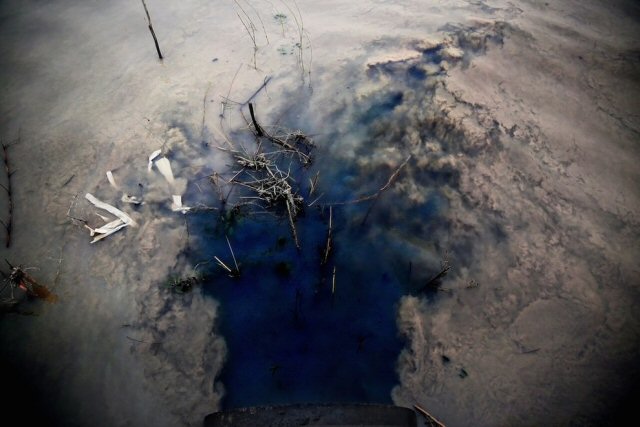
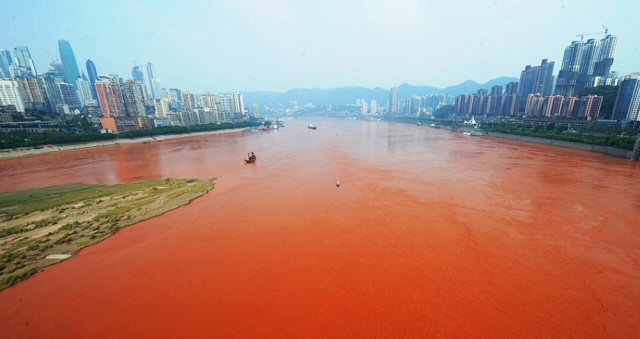
Yangtze River

Purple river

Pink pollution
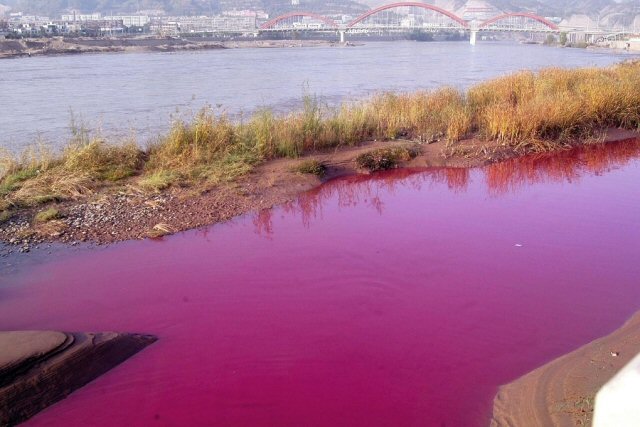
Pink pollution & city
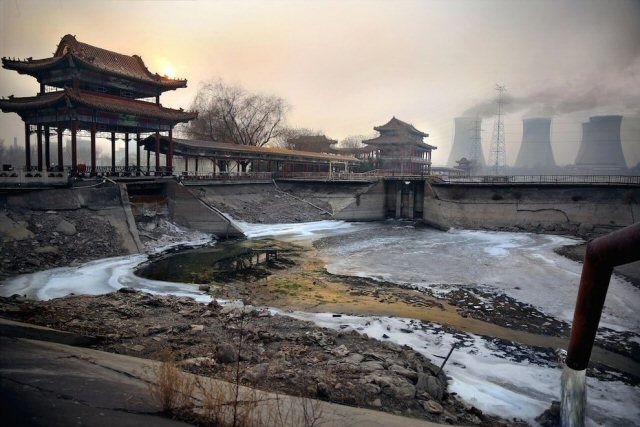
Coal plant, steel factory, polluted water
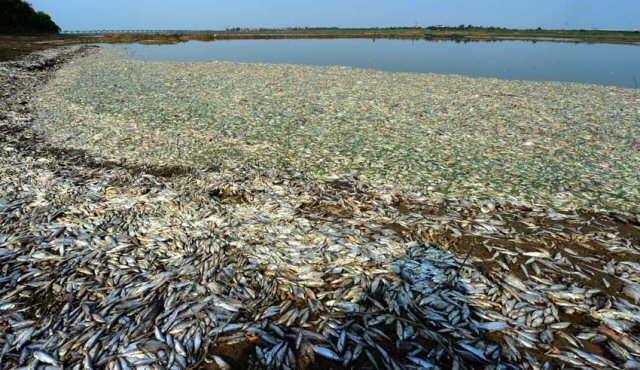
Death
Although serious obstacles remain, China is finally making progress on tapping its vast shale gas reserves, which hold the promise of a new source of clean energy for the coal smoke-choked country.
According to the U.S. Energy Information Administration, China holds the world’s largest reserves of technically recoverable shale gas in the world, 1,115 trillion cubic feet. That’s about 68 percent more than what the U.S. holds.
A report from Bloomberg New Energy Finance finds that China may actually hit its 2015 shale gas production target, which the central government has mandated. Researchers analyzed the results of well data from the Fuling block in the Sichuan Basin, state-owned firm Sinopec is making substantial progress, and the national target of 6.5 billion cubic meters per year (480 million cubic feet per day) by 2015 could be within reach.
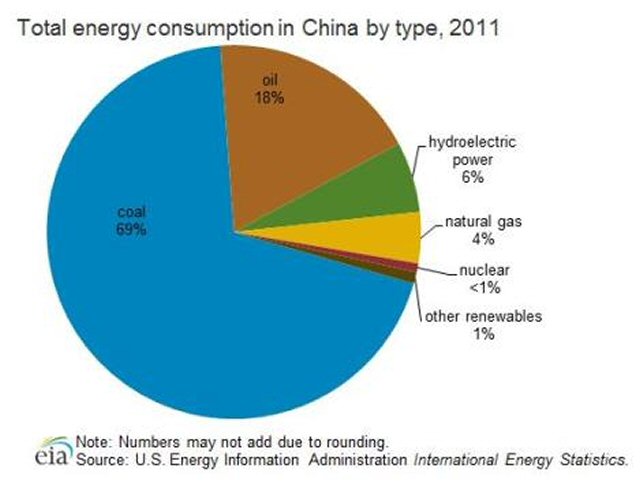
By 2017, China is aiming to lift natural gas consumption to 9 percent of total energy demand, up from 5.2 percent in 2013. China has already made some progress on that front, as natural gas only made up 4 percent of energy demand just two years ago (see chart).
Australia is building a massive project for new liquefied natural gas (LNG). Already one of the world’s largest exporters of LNG, Australia plans on moving to the top spot over the next 3-4 years, potentially overtaking Qatar. It currently has the capacity to export 23 million tons per annum (mtpa), but it plans to almost quadruple that total by 2017. The 62 mtpa under construction there accounts for almost two-thirds of the total LNG capacity under construction around the world.
Cornell University Study on Fracking (2011, in English, .pdf file), entitled Methane and the Greenhouse-Gas Footprint of Natural Gas from Shale Formations
[google-translator]
Report (in English, .pdf file) dated May 29, 2014 from the U.S. Department of Energy showing that liquefied natural gas (LNG), which is mostly methane and 86 to 105 times a more potent greenhouse gas than carbon dioxide, offers no appreciable climate benefit over coal. The reason: leaks in its production, delivery, and liquefaction process. See page 18 of the report.
[google-translator]
A 2014 report (external link in English, large .pdf file, 218 pages) prepared by teams of energy experts from the world’s 15 largest economies under the auspices of the Sustainable Development Solutions Network (SDSN) and the Institute for Sustainable Development and International Relations (IDDRI), a global initiative for the United Nations, on a pathway to cut carbon emissions by 2050 while maintaining reasonable rates of growth. It will require:
In contrast, Plan A:
[google-translator]
The first worldwide report (in English) on future emissions of carbon dioxide, also known as “committed emissions,” prepared by Steve J Davis (Department of Earth System Science, University of California, Irvine, CA 92697) and Robert H Soicolow (Department of Mechanical and Aerospace Engineering, Princeton University, Princeton, NJ 08544), published by IOP Publishing (Open Access) and the journal Environmental Research Letters, August 2014. The study shows that despite international efforts to reduce CO2 emissions, total remaining commitments in the global power sector have not declined in a single year since 1950 and are in fact growing rapidly—by an average of 4 percent per year from 2000 to 2012.
By region, the United States is retiring more plants than it’s building and the European Union is unchanged –about the same number of plants are being built as are being retired. But in China, India, Indonesia, Iran and Saudi Arabia, as much as 4 times as many plants are being built as are being retired. To be sure, since 2010 China has slowed construction of coal-fired power plants, however Southeast Asia has been building more to expand industrial output.
[google-translator]
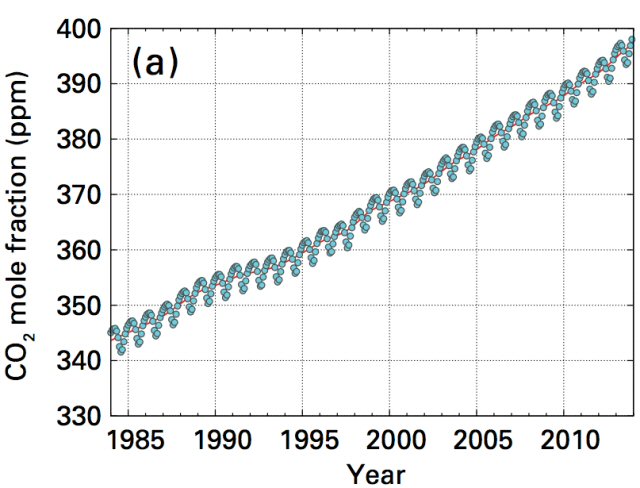
A World Meteorological Organization (WMO) report (in English) reveals that between 2012 and 2013, carbon dioxide increased by 2.9 parts per million (ppm) to an average of 396 ppm.
The chart below shows how average CO2 levels have risen over time.
[google-translator]
This September 2014 Low Carbon Economy Index by multinational accounting firm Pricewaterhouse-Coopers measures how G-20 countries are performing relative to their agreement at the 2009 United Nations Framework Convention on Climate Change to do what they must to keep global temperatures within 2 degrees Celsius of pre-industrial levels. The result: almost everyone is falling short. Their performance is critical; together they account for 85 percent of global carbon emissions.