Production

Hydrogen production processes can be classified generally as those using fossil or renewable (biomass) feedstocks and electricity. The technology options for fossil fuels include reforming, primarily of natural gas in “on-purpose” hydrogen production plants, and production of hydrogen as a byproduct in the petroleum refining process. Electrolysis processes using grid or dedicated energy sources, including some advanced techniques that have not yet been proven, also can be used.

On-Purpose Hydrogen Production Technologies

The on-purpose hydrogen production technologies are reforming, partial oxidation (including gasification), and electrolysis. Each process has its own advantages and disadvantages with respect to capital costs, efficiency, life-cycle emissions, and technological progress.

Electrolysis, or water splitting, uses energy to split water molecules into their basic constituents of hydrogen and oxygen. The energy for the electrolysis reaction can be supplied in the form of either heat or electricity. Large-scale electrolysis of brine (saltwater) has been commercialized for chemical applications. Some small-scale electrolysis systems also supply hydrogen for high-purity chemical applications, although for most medium- and small-scale applications of hydrogen fuels, electrolysis is cost-prohibitive.

One drawback with all hydrogen production processes is that there is a net energy loss associated with hydrogen production, with the losses from electrolysis technologies being among the largest. The laws of energy conservation dictate that the total amount of energy recovered from the recombination of hydrogen and oxygen must always be less than the amount of energy required to split the original water molecule. For electrolysis, the efficiency of converting electricity to hydrogen is 60 to 63 percent. To the extent that electricity production itself involves large transformation losses, however, the efficiency of hydrogen production through electrolysis relative to the primary energy content of the fuel input to generation would be significantly lower.

Economics of Hydrogen Production Technologies

The economics of hydrogen production depend on the underlying efficiency of the technology employed, the current state of its development (i.e., early stage, developmental, mature, etc.), the scale of the plant, its annual utilization, and the cost of its feedstock.

Electrolysis technologies suffer from a combination of higher capital costs, lower conversion efficiency, and a generally higher feedstock cost when the required electricity input is considered. A distributed electrolysis unit using grid-supplied electricity is estimated to have a production cost of $6.77 per kilogram of hydrogen when the assumed 70-percent capacity factor is considered. A central electrolysis unit operating at 90-percent capacity factor, with 30 percent of the power requirements coming from wind and 70 percent from the grid, is estimated to have a production cost roughly 15 percent higher than that of a distributed SMR plant.

Because electrolysis technologies generally have higher capital and operating and maintenance costs, the implied price for electricity would have to be lower to achieve cost parity with a fossil or biomass feedstock.

Source: U.S. Energy Information Administration
Supply of Hydrogen

Hydrogen is the most abundant element in the universe. Yet, there is effectively no natural hydrogen gas resource on Earth. Hydrogen gas is the smallest and lightest of all molecules. When released, it quickly rises to the upper atmosphere and dissipates, leaving virtually no hydrogen gas on the Earth’s surface. Because hydrogen gas must be manufactured from feedstocks that contain hydrogen compounds, it is considered to be an energy carrier, like electricity, rather than a primary energy resource.

Currently, the main sources of hydrogen are hydrocarbon feedstocks such as natural gas, coal, and petroleum; however, some of those feedstocks also produce CO2. Thus, to provide overall emission savings, greenhouse gas (GHG) emissions must be mitigated during hydrogen production through CCS (carbon capture and storage) or similar technology, during end use through comparatively greater vehicle efficiency, or at other stages in the life cycle of the hydrogen fuel source. It is generally recognized that demand is not static and the accessibility of resources may be problematic. Also, the costs for addressing CO2 and other GHG emissions may increase, which could deter the full utilization of fossil fuels as a primary energy source for a hydrogen economy unless suitable mitigation measures are employed.

Another source for hydrogen production is electrolysis of water. For decades, the National Aeronautics and Space Administration (NASA) has used this process in hydrogen fuel cells to produce both power and water for its astronauts in space. However, hydrogen production from conventional grid-based electricity is an expensive process, as discussed below, and at present it is the least carbon-neutral method for hydrogen production, given that more than 49 percent of U.S. electricity generation in 2007 was from coal-fired power plants. Reducing costs and emission impacts may be achievable through the application of CO2 mitigation measures for existing electricity generation technologies or through breakthroughs in advanced electrolysis technologies.

The construction of new renewable generation capacity for the exclusive purpose of producing hydrogen from electrolysis is unlikely to be desirable from an investment perspective if, in order to make the resulting hydrogen competitive, the cost of the electricity is required to be less than the wholesale price at which that electricity could be sold to the grid.

Under a CO2-constrained scenario, large amounts of existing coal-fired capacity are likely to be retired, and new nuclear and renewable generators are likely to be added, to meet the CO2 emissions target. Because a CO2-constrained scenario is defined by policies that achieve a targeted level of CO2 emission reductions, any grid-based power production would already have those target CO2 emission levels factored into prices, with wind, biomass, and other power sources having been rewarded for their contributions, and higher CO2-emitting technologies having been penalized, as appropriate.

Source: U.S. Energy Information Administration

Greenhouse gas volumes at record level in 2012

November 6, 2013

At a news conference presenting the annual Greenhouse Gas Bulletin, Secretary General Michel Jarraud of the United Nations’ World Meteorological Organization (WMO) said that the agency has determined that volumes of greenhouse gases blamed for climate change hit a new record in 2012. “The trend is accelerating,” he said, “with year on year increases since 2010.” The volume of carbon dioxide, or CO2, the primary greenhouse gas emitted by human activities, grew faster in 2012 than in the previous decade, reaching 393.1 parts per million (ppm), 41 percent above the pre-industrial level. Its concentration in the atmosphere grew 2.2 ppm, higher than the average of 2.02 ppm over the past 10 years and the highest in over 800,000 years.

At this pace, in 2020 greenhouse gas emissions will exceed the maximum needed to contain global warming below 2 degrees by 8-12 billion tons; as a result, the 2 degree mark will likely be reached in mid-century.

“The increase in CO2 is mostly due to human activities,” Jarraud said. “The actions we take or don’t take now will have consequences for a very, very long period.”

It’s time to act.

Man-Cession

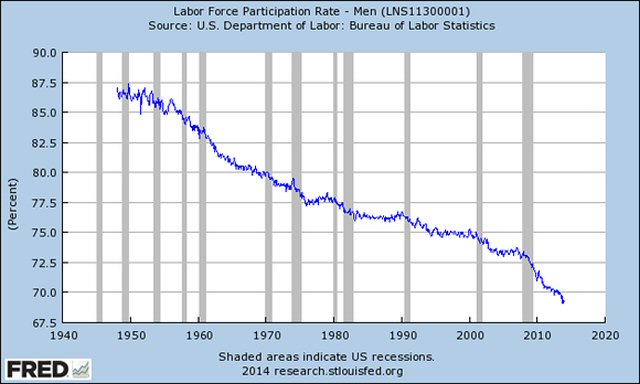
Labor Participation - Men 2014


In the mid 1950s, nearly every man in his prime working years was in the labor force, a category that includes both those who are employed and those actively applying for jobs. Early in 1956 the “participation rate” for men ages 25 to 54 stood at 97.7%. By late 2012 it had declined to a post-war record low of 88.4%.

Where did they go? Some went into prison. Others are on disability or can’t find jobs in occupations that are now obsolete, exported, or taken over by women, who (still) get paid less for the same work.

The trend is especially pronounced among the less educated. As the available blue-collar jobs in manufacturing, production and other fields traditionally dominated by men without college diplomas declined, many were left behind. But men with college degrees are leaving, too. The participation rate of those older than 25 and holding at least a bachelor’s degree fell to 80.2% in May 2013, down from 87.2% in 1992.

The economic cycles since World War II have failed to stem this downward slide, even when the unemployment rate hit a 30-year low in the early 2000s. The Great Recession accelerated the trend, pushing the participation rate for men in their prime working years below 90% for the first time.

Here’s a breakdown of the reasons why men are dropping out of the labor force.

Prison

A growing number of men have served time in jail, which makes it much harder to be accepted for a job once they complete their sentences. 1.2% of white men and 9% of black men born just after World War II went to jail prior to 2004. In contrast, for those born 30 years later, the rates were 3.3% and 20.7% respectively.

Disability

More men have been pouring into the federal disability system, especially in recent years, when the Great Recession and its aftermath pushed up the national unemployment rate. According to data from the National Academy of Social Insurance, in 1982 around 1.9% of working-age men were receiving disability benefits. By 2012, that number had climbed to 3.1%. Once on the disability rolls, few people get off. Only 2.2% did so in the first quarter of 2013.

Lack of education

A few decades ago, men could graduate high school and make a decent living on a factory floor or at a construction job. As the labor market becomes more skilled, those guys are being left behind. For less than wealthy individuals, the already high (and increasing) cost of a college education that does not guarantee a job upon graduation means accepting responsibility for non-dischargeable debt, equal to or higher than the mortgage on a home. Social networks are full of tales alerting them to the consequences of being forced to accept minimum wage jobs: the despair of little or no disposable income that leaves them unable to compete for the affection of women who, incidentally, may earn far more than they.

Competition from women

According to data in Wayward Sons, in the 1960s more men than women were enrolling in and completing college. Women born in 1975 were roughly 17% more likely than their male counterparts to attend college and nearly 23% more likely to complete a four-year degree.

Obviously, many non-college men refuse to work in low-paying jobs. The decline of men in the labor force has broad, deep ramifications for families, taxpayers and the economy. Fewer employed men mean higher entitlements, reduced tax revenue, a potential for higher crime rates, and more unstable relationships with single-parent households. Perhaps the single most important consequence is that these unemployed adult men are also voters. Naturally they may favor candidates that believe that it is the government’s responsibility to see to it that well-paying, permanent jobs are plentiful.

Depletion And Pollution

Depletion and Pollution of Water

The world is facing extraordinarily serious fresh water depletion and pollution, both exacerbated by ever rising demand. Over the next 40 years estimates are that demand for water will rise 50% while demand for food will rise 70%, all in the same period that we’ll be forced to confront climate change and depletion of rivers and aquifers.

Farming (and to a lesser extent, other human activities) are the main culprits. Growing food for an average human diet requires an estimated 320 gallons of water a day. For an average American diet the number is closer to 900 gallons of water a day. Agriculture depends on water, consuming fully 70% of the world’s fresh water. To produce that water, we’re draining rivers, lakes, and fossil water aquifers at an unsustainable rate. Runoffs of pesticides and fertilizers are the largest sources of pollution in US lakes and rivers, directly responsible for an 8,000 square mile dead zone in the Gulf of Mexico.

Beneath the American high plains of Nebraska, Kansas, northern Texas, and five other states lies the Ogallala Aquifer, a giant underground reservoir of fresh water that farms and people in the region depend on. Ogallala is full of ‘fossil water’ – the remnants of the glaciers and ice sheets that retreated from this area more than 10,000 years ago, melting and filling underwater basins as they went. That fossil water is used to irrigate 27% of the farmland in the United States. In two months the water we withdraw from Ogallala is enough to fill a cube a mile on a side. As a result, the aquifer’s water level is dropping, in some places as fast as three feet per year. On current course and speed, it will run dry before this century is over, and possibly much sooner.

The rate at which we consume water – particularly for agriculture – exceeds the rate at which we can capture it from rain or from sustainable withdrawals from rivers.

The Indus River Valley aquifer is being drained at a rate of 20 cubic kilometers a year. Water tables in Gujarat province are falling by as much as 20 feet a year. The giant North China Plain aquifer, which provides irrigation for fields that feed hundreds of millions, has been found to drop as much as 10 feet in a single year. A World Bank report cautions that in some places in northern China, wells have to be drilled nearly half a mile deep to find fresh water. Hebei province, one of five atop the aquifer, has seen more than 900 of its 1,052 lakes dry up and disappear due to dropping water tables. In Mexico’s agricultural state of Guanajuato, the water table is dropping by 6 feet a year. In north eastern Iran, it’s dropping by as much as 10 feet a year.

Water is being withdrawn from rivers as well. Seasonal water levels are dropping on China’s Yellow River, on the Nile in Egypt, on the Indus as far north as Pakistan, and on the Rio Grande in the US. Parts of the Colorado River are a stunning 130 feet below their historic levels. The river no longer reaches the sea. Nor does the Yellow River or dozens of others around the world that have been tapped for irrigation. The rivers that flow through Central Asia have been so massively drained for agriculture that the vast Aral Sea they once fed, once the fourth largest freshwater lake in the world, is now little more than a dry, salty lake bed, its former shore dotted with abandoned fishing villages and the bones of beached boats.

70% of the world’s surface is covered in water. Yet the vast majority of that water – around 97% of it – is salt water. Another 2% is locked up in ice caps and glaciers. Only around 1% of the world’s water is fresh, and of that, humanity can only easily access about a tenth, or 0.1%.

If we could efficiently convert salt water to fresh, we’d have access to a vast supply of water to use in growing crops and sustaining human civilization. For decades, desalination has been considered a deeply anti-environmental process, primarily because it consumes enormous amounts of energy and releases huge amounts of greenhouse gases.

However, with sufficient cheap renewable energy from technological discoveries, our featured solution could create water supplies many times larger than any projected human need.

Demographic Change And Racial Inequalities

07/14/2013

The success of minority children who will form a new majority is crucial to future U.S. economic competitiveness.

A wave of immigration, the aging of non-Hispanic white women beyond child-bearing years and a new baby boom are diminishing the proportion of children who are white. Already, half of U.S. children younger than 1 are Hispanic, black, Asian, Native American or of mixed races.

“A lot of people think demographics alone will bring about change and it won’t,” said Gail Christopher, who heads the W.K. Kellogg Foundation’s America Healing project on racial equity. “If attitudes and behaviors don’t change, demographics will just mean we’ll have a majority population that is low-income, improperly educated, disproportionately incarcerated with greater health disparities.”

In 2010, 39.4 percent of black children, 34 percent of Hispanic children and 38 percent of American Indian and Alaska Native children lived in poverty, defined as an annual income of $22,113 that year for a family of four. That compares with about 18 percent of white, non-Hispanic children, according to Census Bureau’s 2011 American Community Survey.

Asian children overall fare better, with 13.5 percent living in poverty, the survey said.

The overrepresentation of minority children among the poor is not new. What is new is that minority children will, in the not-too-distant future, form the core of the nation’s workforce, and their taxes will be depended on to keep solvent entitlement programs for the elderly.

Based on where things stand for nonwhite children today, it’s not hard to make some educated guesses about what the future holds for the youngest of America’s children who already are a majority of their age group, said Sam Fulwood III, a senior fellow at the Center for American Progress.

The recent recession worsened conditions for many children, but minorities were hard hit and are having more difficulty recovering.

The Pew Charitable Trusts found that, from 1999 to 2009, 23 percent of black families and 27 percent of Hispanic families experienced long-term unemployment, compared with 11 percent of white families. Pew Research Center, a subsidiary, found that the median wealth of white households is 20 times that of black households and 18 times that of Hispanic households.

That means more minority families end up in poor neighborhoods with underperforming school systems, leading to lower graduation rates and lower lifetime earnings, said Leonard Greenhalgh, a professor of management at Tuck School of Business at Dartmouth College in New Hampshire.

“You are looking at the future workforce of the United States — what we need to be competitive against rival economies such as India and China, and we are not educating the largest, fastest growing percentage of the U.S. workforce, so as a nation we lose competitive advantage,” Greenhalgh said.

It all starts with preschool, where overall enrollment has been increasing but Hispanic children are less likely to be included. Of Hispanic children ages 3 to 5 in the U.S., 13.4 percent were enrolled in full-day public or private nursery school in 2011, according to data from the National Center for Education Statistics.

That compares with 25.8 percent of black children enrolled in full-day preschool and 18.1 percent of white children. But already, Hispanics are one-quarter of students enrolled in public schools.

Compounding the issue, experts say, is immigration status. About 4.5 million children of all races born in the U.S. have at least one parent not legally in the U.S., according to the Pew Hispanic Center. More than two-thirds of impoverished Latino children are the children of at least one immigrant parent, the center reported.

The picture isn’t all bleak. History and recent data show improvements for the next generations of immigrant families.

The Pew Research Center found second-generation Americans, some 20 million U.S.-born children of 20th century immigrants, are better off than their immigrant parents. They have higher incomes, more graduate from college and are homeowners and fewer live in poverty, the study found.

Many experts on low-income children see good health as one more building block for education and prosperity. Children are less likely to learn if they are ill and missing school and unable to see a doctor.

In 2011, about 94 percent of black children, 92.3 percent of Asian/Native Hawaiian and Pacific Islander children and 95 percent of white children had health insurance coverage, while 87.2 percent of Hispanic children and 83.4 percent of American Indian and Alaska Native children had some form of health insurance coverage, according to a study by Georgetown University’s Center for Children and Families.

The numbers of uninsured children are at a historic low — just 7.5 percent, said Joan Alker, the center’s executive director.

While 73.1 percent of white children had private coverage, more than half of black and Hispanic children got health care through Medicaid and the Children’s Health Insurance Programs and similar federal and state subsidized programs, the Federal Interagency Forum on Child and Family Statistics reported.

Unrecognizable Planet?

Planet ‘unrecognizable’ by 2050 – Experts

2/20/2011

A growing, more affluent population competing for ever scarcer resources could make for an “unrecognizable” world by 2050, researchers warned at a major US science conference Sunday.

The United Nations has predicted the global population will reach seven billion this year, and climb to nine billion by 2050, “with almost all of the growth occurring in poor countries, particularly Africa and South Asia,” said John Bongaarts of the non-profit Population Council.

To feed all those mouths, “we will need to produce as much food in the next 40 years as we have in the last 8,000,” said Jason Clay of the World Wildlife Fund at the annual meeting of the American Association for the Advancement of Science (AAAS).

“By 2050 we will not have a planet left that is recognizable” if current trends continue, Clay said.

The swelling population will exacerbate problems, such as resource depletion, particularly water, which is projected to be severely impacted by global warming.

But incomes are also expected to rise over the next 40 years — tripling globally and quintupling in developing nations — and add more strain to global food supplies.

People tend to move up the food chain as their incomes rise, consuming more meat than they might have when they made less money, the experts said.

It takes around seven pounds (3.4 kilograms) of grain to produce a pound of meat, and around three to four pounds of grain to produce a pound of cheese or eggs, experts told AFP.

“More people, more money, more consumption, but the same planet,” Clay said, urging scientists and governments to start making changes now to how food is produced.

$60 Trillion Cost Of Global Warming?

The Truth Behind That $60 Trillion Climate Change Price Tag

If all the methane off the East Siberian seafloor was released, the fallout would cost $60 trillion—a huge, staggering number.

For comparison’s sake, the world’s GDP is $70 trillion. The findings assume that 50 gigatons of methane would be released over the course of 10-to-20 years in a warming pulse.

Some climate scientists disagree with the underlying assumption. Gavin Schmidt has taken to Twitter to argue that 50 gigatons is an excessive estimate; prior warming periods didn’t show similarly large releases of methane.

On the other hand, climate scientist Dr. Michael Mann believes that “the precise magnitude of methane is an object of valid debate, but the possibility of a substantial release cannot be dismissed out of hand.” Climate modelers have underestimated Greenland sheet ice and Arctic sea ice melt, so the estimate is not outside the realm of possibility.

The authors make it clear that they’re responding to exuberant claims of $100 billion in short term benefits from a warming Arctic—if the sea ice melts, trade routes will be shortened. Neither the World Economic Forum (WEF) in its Global Risk Report, nor the International Monetary Fund in its World Economic Outlook, recognizes the potential economic threat from changes in the Arctic.

Very large numbers make us sit up and take notice, but they’re also hard to grasp. What is climate change currently costing even without that warming pulse? A NRDC report estimates that American taxpayers, through the federal government, paid $100 billion in 2012—more than the cost of education or transportation. And that doesn’t include what state and local governments, insurers, or private citizens paid. Mann estimates the global cost at $1.4 trillion per year in coastal damage, droughts, fires, floods and hurricanes.

Dying Oceans

Acid Test: Rising CO2 Levels Killing Ocean Life (Op-Ed)

Matt Huelsenbeck, Oceana 07/17/2013

Matt Huelsenbeck is a marine scientist for the climate and energy campaign at Oceana. Huelsenbeck contributed this article to LiveScience’s Expert Voices: Op-Ed & Insights.

The ocean absorbs approximately one-third of all human-caused carbon dioxide emissions at a rate of 300 tons per second, which helps slow global climate change. But, due to that carbon dioxide absorption, the ocean is now 30 percent more acidic than before the Industrial Revolution, and the rate of change in ocean pH, called ocean acidification (video), is likely unparalleled in Earth’s history.

With today’s levels of atmospheric carbon dioxide so high, the ocean’s help comes at a cost to marine life and the millions of people who depend on healthy oceans.

For the first time in human history, atmospheric carbon dioxide levels have risen above 400 parts per million (ppm) of carbon dioxide at the historic Mauna Loa Observatory in Hawaii. This observatory is where Scripps Institution of Oceanography researcher Charles David Keeling created the “Keeling Curve,” a famous graph showing that atmospheric carbon dioxide concentrations have been increasing rapidly in the atmosphere for decades.

Carbon dioxide levels were around 280 ppm before the Industrial Revolution, when humans began releasing large amounts of the gas into the atmosphere by burning fossil fuels. On May 9, 2013, the reading was an alarming 400.08 ppm for a 24-hour period. This number would be even higher, however, if it were not for the help of the oceans. [Atmospheric Carbon Dioxide Breaks 3-Million-Year Record]

Scientists already see ocean acidification harming marine animals like oysters, mussels and clams as well as coral reefs and floating marine snails called pteropods, dubbed the “potato chips of the sea” because of their significance to marine food webs. In the last decade, ocean acidification killed many oyster larvae at the Whisky Creek oyster hatchery in Oregon, shrunk the shells of pteropods in the Southern Ocean and slowed coral growth on Australia’s Great Barrier Reef.

Society’s use of fossil fuels is putting the world’s marine life through a high-risk chemistry experiment with no fail-safes in place and no way to turn back. Earlier in Earth’s history, changes in ocean conditions that were much slower than today still managed to wipe out 95 percent of marine species. If emissions continue at current rates, our planet is risking a similar mass extinction event, one that could begin within our lifetimes.

These impacts will ripple up to threaten people as well, who are at the top of the ocean food web. In September 2012, an Oceana report entitled “Ocean-Based Food Security Threatened in a High CO2 World” ranked nations based on their vulnerability to reductions in seafood production due to climate change and ocean acidification. Many island nations rely on seafood as one of their main food sources, since it is the cheapest and most readily available source of protein. Threats to seafood especially threaten small-scale fishermen, who simply aren’t capable of following fish into distant waters.

Reducing carbon dioxide emissions is the only way to confront global ocean acidification and the primary means to stop climate change. Oceana is currently working to limit pollution emissions that threaten the ocean by halting the expansion of offshore drilling and supporting clean energy solutions like offshore wind. In the Atlantic Ocean, oil companies are trying to take their first step toward drilling for offshore oil and gas with seismic airgun surveys that would injure dolphins and whales with loud blasts. The more oil they find and the more drilling that occurs, the worse climate change becomes.

The current rate of change in ocean conditions is simply too high for many marine animals to adapt, but to avoid further harm, society needs to create an even faster rate of change in energy supply options. If not, our planet risks losing the diversity and abundance of ocean life that we all depend on.

This article was originally published on LiveScience.com.

Intergovernmental Panel On Climate Change Report

Climate Change Report Predicts Tragedies

November 2, 2013

According to a new report, starvation, poverty, flooding, heat waves, droughts, war and disease are likely to worsen as the world warms from man-made climate change.

The Nobel Peace Prize-winning Intergovernmental Panel on Climate Change Report describes how global warming is already affecting the way people live and projects what will happen in the future, including a worldwide drop in income.

Cities, where most of the world now lives, are particularly vulnerability, as are the globe’s poorest people.

The report says scientists have high confidence especially in what it calls certain “key risks”:

-People dying from warming- and sea rise-related flooding, especially in big cities.

-Famine because of temperature and rain changes, especially for poorer nations.

-Farmers going broke because of lack of water.

-Infrastructure failures because of extreme weather.

-Dangerous and deadly heat waves worsening.

-Certain land and marine ecosystems failing.

“Human interface with the climate system is occurring and climate change poses risks for human and natural systems,” the 29-page summary says.

Pennsylvania State University climate scientist Michael Mann, who wasn’t part of the international study team, said the report’s summary confirmed what researchers have known for a long time: “Climate change threatens our health, land, food and water security.”

The Summary Report dated 11/01/2013 can be viewed here.

WordPress theme: Kippis 1.15
Translate »